The phrase that sells monitoring tools is “preventing downtime”. The phrase that actually justifies them is “knowing what’s happening before customers tell you”. A web app where you find out about the 500 errors from an angry support email is not a monitored web app. A web app where the on-call engineer’s pager goes off three minutes before the support email lands is the difference monitoring makes.
This post covers the two stacks I default to for client environments: Grafana + Prometheus + Loki + Promtail (the heavyweight, full-control DIY stack) and Netdata (the deploy-in-minutes alternative). Plus where Uptime Kuma fits and why you usually want both inside-out and outside-in monitoring.
Why monitoring matters in business terms
A few specific numbers worth keeping in mind:
- The Atlassian incident-management benchmark puts the average cost of downtime at $5,600 per minute, with significant variance by company size and industry. For a SaaS or e-commerce business, the ratio between “minutes of unplanned downtime” and “lost revenue” is approximately linear.
- A Gartner study covered the same range, with figures sometimes pushing past $9,000 per minute for larger enterprises.
- Search engines penalize sites that are frequently unreachable. The SEO impact compounds for weeks after the actual outage, well past the immediate revenue loss.
The numbers vary by source. The direction doesn’t: every minute of unplanned downtime costs more than the monitoring stack does in a year.
What good monitoring covers
A real observability stack covers four layers:
- Metrics. Numeric system measurements: CPU utilization, memory pressure, request latency, queue depth. Good for “is this trending bad” questions. Prometheus and Netdata are the open-source defaults.
- Logs. Text events from applications and the system: a user logged in, an exception was thrown, a database query was slow. Good for “what exactly happened at 03:14 UTC” questions. Loki is the lightweight default; Elasticsearch is the heavyweight one.
- Uptime checks. Outside-in pings, HTTP probes, DNS lookups. Good for “is the site reachable from a real user’s perspective” questions. Uptime Kuma covers this for self-hosted setups.
- Tracing. Distributed traces across microservices. Good for “why is this specific request slow”. Optional for most setups; mandatory for microservices architectures. Tempo (Grafana’s tracing backend) is the OSS default.
This post focuses on the first three. Tracing is a bigger topic that deserves its own post.
The DIY stack: Grafana + Prometheus + Loki + Promtail + Node Exporter
The combination I run on most managed servers is Grafana for dashboards, Prometheus for metrics, Loki for logs, Promtail to ship logs to Loki, and Node Exporter to expose host metrics to Prometheus. All open-source, all from the same Grafana ecosystem, all designed to compose.
How the pieces fit together:
- Node Exporter runs on every host, exposing CPU/memory/disk/network metrics on a port.
- Prometheus pulls metrics from every Node Exporter (and from any other exporters: PostgreSQL, Nginx, Redis, your custom apps).
- Promtail runs on every host, tailing log files (and journald) and shipping log lines to Loki.
- Loki stores the logs, indexed by labels (host, service, severity).
- Grafana queries both Prometheus and Loki and renders dashboards. Same query interface for both.
The advantage is full control: you own the data, you write the queries, you build the dashboards your team actually needs. The trade-off is operational tax: this stack takes a day to set up properly the first time, and ongoing maintenance is real.
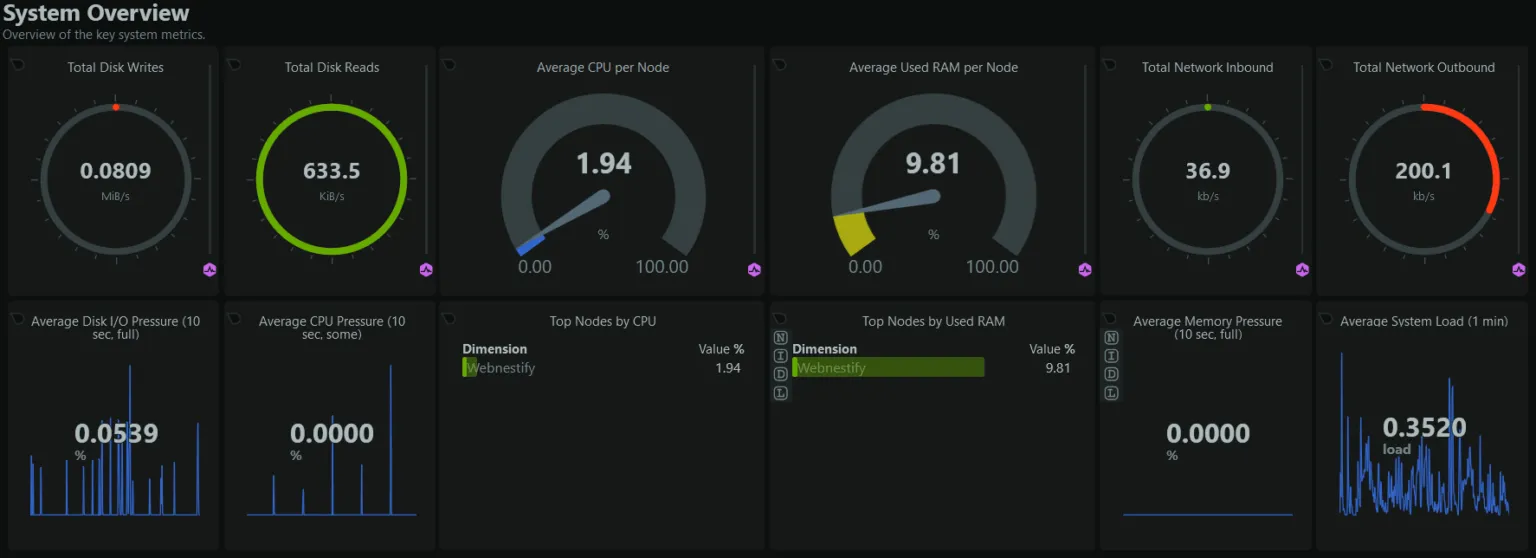
Netdata’s per-second dashboard for the same data. The Grafana version takes more setup but gives you historical analysis the live dashboard can’t.
The fast-deployment alternative: Netdata
When the situation is “we need monitoring before tomorrow”, I deploy Netdata. It’s per-second granularity, auto-discovery of running services, dashboards built before you’ve finished the install, and it runs on every system I’ve thrown it at. The install is one shell script.
What Netdata does well:
- Real-time. Per-second metrics with second-resolution charts. Most monitoring tools sample every 15-60 seconds; Netdata samples every second.
- Auto-discovery. Spins up dashboards for every service it detects (Postgres, Nginx, MySQL, Docker containers, system services).
- AI-powered anomaly detection. Highlights metrics that are behaving unusually compared to historical baselines.
- Lightweight footprint. Designed to run on every host, even resource-constrained ones (Raspberry Pi-class hardware is fine).
- Self-hosted by default. The data stays on the host or on a Netdata server you control.
What Netdata doesn’t do:
- Long-term metric storage. The local Netdata stores about a day of data by default; longer retention requires their cloud service or a Prometheus integration.
- Cross-host queries the way Prometheus does. Each Netdata is somewhat siloed; cross-host correlation requires the central Netdata Cloud or pushing the data into Prometheus.
Outside-in: Uptime Kuma
Uptime Kuma is the status-page tool I default to. It runs HTTP, TCP, ping, and DNS checks against your services from a separate server (or from a public monitoring host) and pages you when they fail. (My Uptime Kuma self-hosted deployment post is the production setup I run for clients.)
Why this matters: a server is “up” doesn’t mean it’s reachable. A firewall change can drop traffic without taking the server itself down. Netdata or Prometheus running on the host won’t notice; Uptime Kuma checking from outside will scream the moment the first HTTP request fails.
Pair Uptime Kuma with metrics monitoring. Inside-out tells you why something broke; outside-in tells you that something broke.
Picking between the stacks
A rough decision tree:
- One server, need monitoring today. Netdata. Five-minute install, dashboards immediately.
- A few servers, need historical analysis and alerting. Prometheus + Grafana + Loki + Promtail + Node Exporter. Take the day to set it up properly.
- Mixed environment, agency managing client servers. Both. Netdata on each host for instant visibility, Prometheus for fleet-wide queries and alerting.
- Need a status page customers can see. Uptime Kuma in front of either stack.
Closing the loop
Monitoring is the unglamorous part of running infrastructure that pays for itself the first time it catches a problem before customers do. The DIY Grafana + Prometheus + Loki stack is the gold standard for full control. Netdata is the fastest route to instant visibility. Uptime Kuma covers the outside-in checks neither of them does well.
If your current monitoring is “we’ll know when something breaks because it’ll break”, the Cloud Infrastructure Audit & Hardening engagement always includes a monitoring audit and a deployed stack as part of the deliverables. For more on the operations side, the operations & automation category has the rest.