Web server choice is one of those decisions agencies usually inherit instead of make. You set up Apache because that’s what cPanel ships with. You set up Nginx because that’s what every “10x your performance” tutorial recommends. Whether either of them was the right pick for the workload nobody actually re-tested.
This is the benchmark I ran to settle that question for myself, on identical hardware, on a vanilla WordPress site. The setup, the numbers, and the conclusions.
Test environment
The same hardware and configuration across every test:
- Server: Hetzner CPX11 (2 vCPU, 2GB RAM, 40GB NVMe SSD, 10Gbit network).
- Control panel: Enhance.
- WordPress: latest release, default theme, PHP 8.1, no Redis, no extra plugins, out-of-the-box configuration.
- Web servers tested: Apache and Nginx without their native caching plugins, LiteSpeed Enterprise with the default LiteSpeed Cache plugin enabled at default settings.
- Load tester: loader.io.
- Test type: Maintain Client Load. Sustained traffic from 1 client/second up to a maximum specified rate over 5 minutes.
- Failure threshold: 1%.
The “Maintain Client Load” test ramps from 1 client/second to the maximum configured rate continuously over 5 minutes. It’s the realistic shape of a traffic spike (sustained, increasing, with the system getting hotter as it goes), not a stress test that fires N requests instantly.
Phase 1: no caching plugin
The first phase tests how each server handles increasing load without any caching layer in front of WordPress. The exception is LiteSpeed, where LSCache ships built into the server and is enabled by default. That’s the honest “out of the box” comparison: nobody adds a caching plugin to LiteSpeed because it doesn’t need one.
Test 1: 1 to 350 clients/second over 5 minutes
Apache.
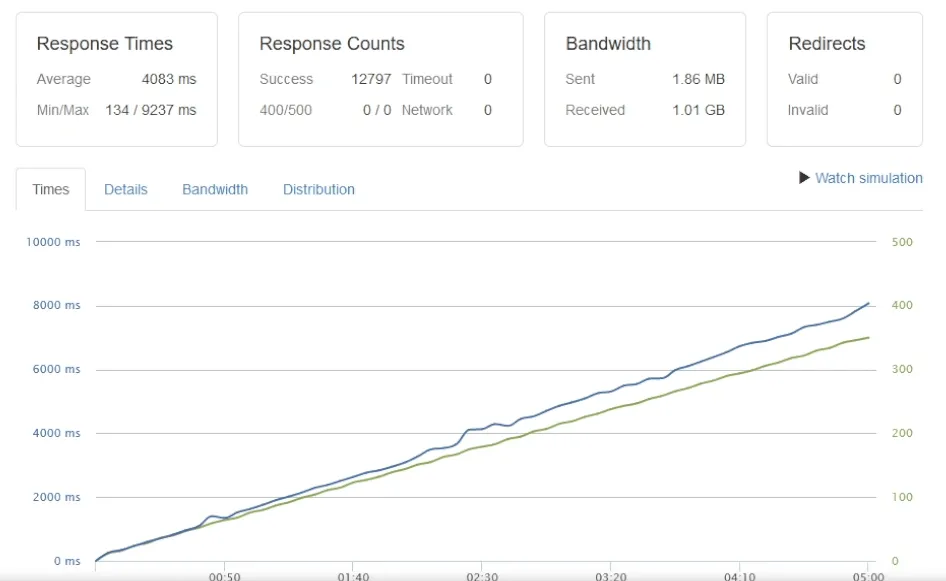
- Average response time: 4,083ms
- Min/max response time: 134ms / 9,237ms
- Successful responses: 12,797
- CPU usage: 100%
Nginx.
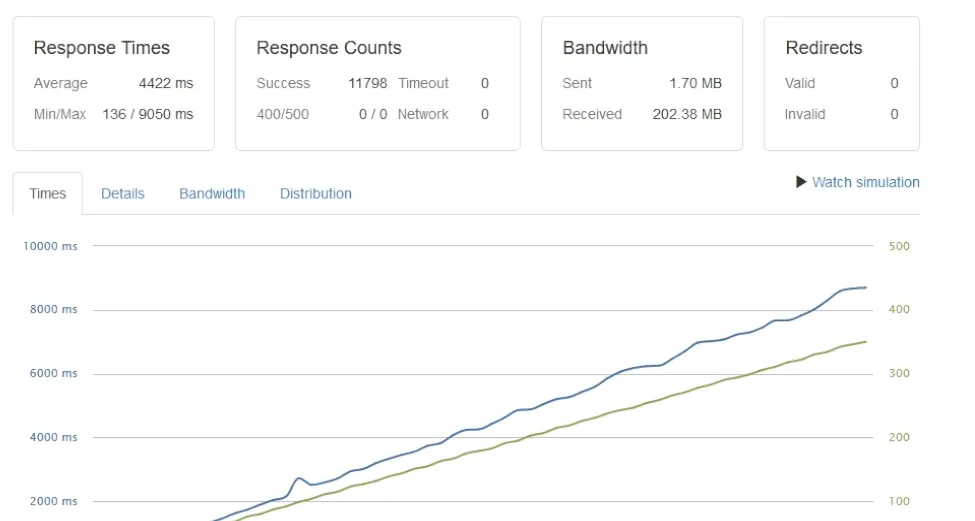
- Average response time: 4,422ms
- Min/max response time: 136ms / 9,050ms
- Successful responses: 11,798
- CPU usage: 100%
LiteSpeed Enterprise.
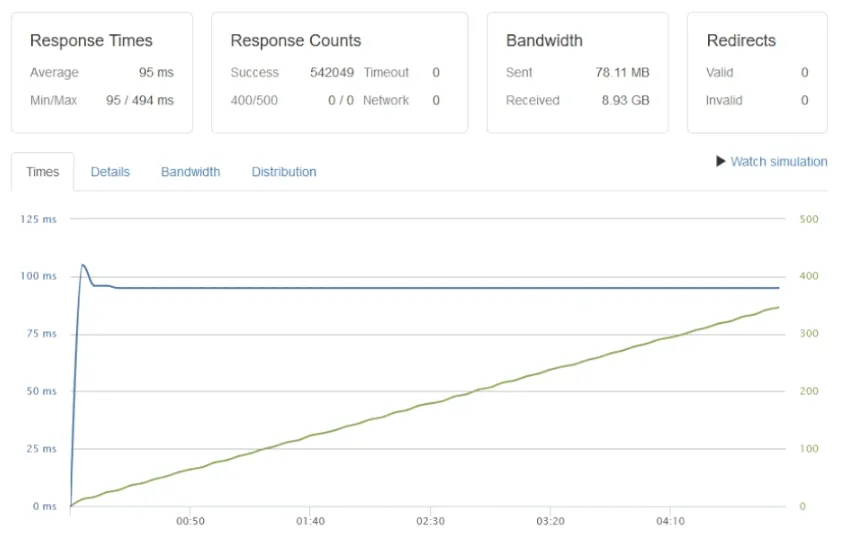
- Average response time: 95ms
- Min/max response time: 95ms / 494ms
- Successful responses: 542,049
- CPU usage: 25-35%
The gap is roughly 40x in successful responses (542,049 vs 12,797) and roughly 40x in average response time (95ms vs 4,083ms). Apache and Nginx both saturate CPU at 100%; LiteSpeed sits comfortably under 35% CPU on the same workload.
Test 2: 1 to 700 clients/second over 5 minutes
Pushing the load to 700 clients/second:
- Apache: 5,244ms average, 8,118 successful responses, 162 timeouts, started timing out at 390 clients/second, CPU 100%.
- Nginx: 5,254ms average, 7,115 successful responses, 363 timeouts, started timing out at 410 clients/second, CPU 100%.
- LiteSpeed Enterprise: 95ms average, 1,114,793 successful responses, 0 timeouts, CPU 35-50%.
Apache and Nginx both fail well below the requested load. LiteSpeed serves over a million requests successfully without a single timeout.
Test 3: 1 to 2,400 clients/second over 5 minutes (LiteSpeed only)
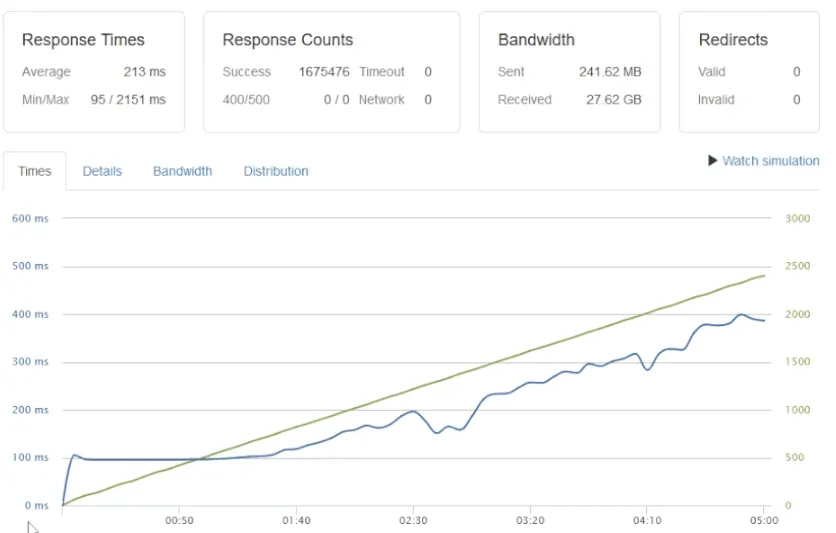
Apache and Nginx couldn’t reach this load level on this hardware. LiteSpeed:
- Average response time: 213ms
- Min/max response time: 95ms / 2,151ms
- Successful responses: 1,675,476
- Timeouts: 0
- CPU usage: 35-100% (with automatic throttling at around 1,000 clients/second to prevent timeouts)
The throttling behavior is the interesting part. LiteSpeed proactively rate-limits incoming requests at the server level when CPU pressure rises, instead of letting requests queue and time out. Apache and Nginx don’t have this built in.
Phase 1 takeaways
- 40-100x performance gap in raw throughput between LiteSpeed and Apache/Nginx without caching.
- CPU efficiency: LiteSpeed handles roughly 100x the workload at 50% the CPU cost.
- Reliability under stress: LiteSpeed has zero timeouts at loads where Apache and Nginx are dropping hundreds of requests.
- Automatic throttling: LiteSpeed’s request management prevents the cascade-failure shape you see in Apache and Nginx under sustained load.
Phase 2: with caching plugin (Apache and Nginx)
Adding WP Fastest Cache to Apache and Nginx to close the gap.
Test 1: 1 to 350 clients/second over 5 minutes
Apache + WP Fastest Cache.
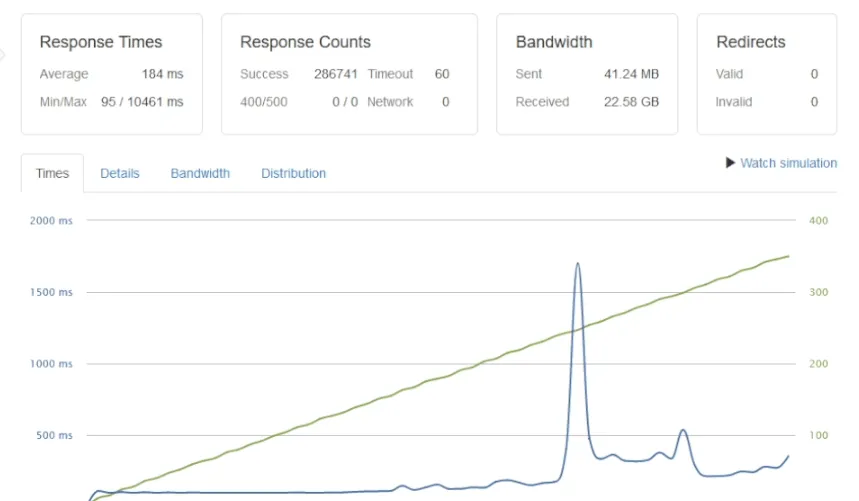
- Average response time: 184ms
- Successful responses: 286,741
- Timeouts: 60 (started timing out at 260 clients/second)
- CPU: 5-100% (hit 30% at 50 clients/sec, 100% at 275 clients/sec)
Nginx + WP Fastest Cache.
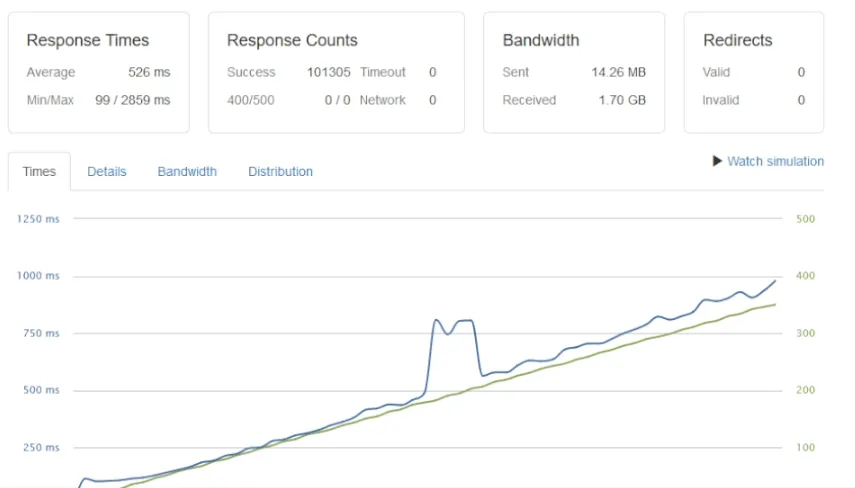
- Average response time: 526ms
- Successful responses: 101,305
- CPU: 20-100% (hit 100% at just 50 clients/sec)
Test 2: 1 to 700 clients/second over 5 minutes (with cache)
- Apache: 184ms average, 286,741 successful responses, 328 timeouts (started at 275 clients/sec), CPU 100% by 275 clients/sec.
- Nginx: 1,050ms average, 100,968 successful responses, 7 timeouts (started at 690 clients/sec), CPU 100% by 50 clients/sec.
Phase 2 takeaways
- Caching helps a lot. Apache went from 12,797 successful responses (no cache) to 286,741 (with WP Fastest Cache) on Test 1. That’s a 22x improvement.
- Apache wins on response time with caching enabled, but Nginx scales further before timing out.
- Neither catches LiteSpeed. LiteSpeed without any plugin still serves 1.5x the requests of Apache + WP Fastest Cache, with response times an order of magnitude lower.
What this means for real WordPress sites
The honest reading of these numbers:
- For high-traffic WordPress, LiteSpeed wins by enough to matter. The 40-100x throughput gap is unusually large for benchmark tests. Most “X is faster than Y” benchmarks land in the 1.2-2x range; this is a different category of difference.
- CPU efficiency matters more than raw throughput. LiteSpeed handling 1.6M requests at 35-100% CPU means a smaller, cheaper VPS can handle the same workload. Hardware savings compound with the license fee.
- Caching plugins help, but they don’t fix architecture. WP Fastest Cache makes Apache and Nginx survive moderate load. They still don’t reach LiteSpeed’s numbers, because LSCache is integrated at the server level instead of running as a PHP plugin.
- These numbers reflect default configurations. A heavily-tuned Nginx with PHP-FPM workers, fastcgi_cache, and a Cloudflare layer would close some of the gap, at the cost of significant ongoing maintenance. Most agencies don’t have that maintenance bandwidth.
For more on the architecture behind these numbers, see my LiteSpeed Enterprise writeup, which covers the LSCache plugin, QUIC.cloud integration, and where LiteSpeed isn’t the right answer.
Closing the loop
For WordPress workloads on entry-level hardware, LiteSpeed Enterprise is in a different performance category than Apache or Nginx. The numbers are reproducible on identical hardware, and the architectural reasons (server-level caching, event-driven worker model, LSAPI for PHP) explain why.
If you’re running WordPress at scale and the performance numbers aren’t where you’d like them, the Cloud Infrastructure Audit & Hardening engagement covers the LiteSpeed migration as part of the managed setup. For more on the cloud infrastructure side, the cloud infrastructure category has the rest, and the LiteSpeed Enterprise overview covers the why behind these numbers.